Services
Lipometrix is built on the combined expertise of our scientific founders. Our major strength, and what sets us apart, is in unraveling complex lipidomics data to establish meaningful links to the underlying biological pathways. This is enabled through world-leading expertise in lipid metabolism, and our unique in-house data visualization software. We are currently developing novel tools to give unpresented biological insights, paving the way to one-step (drug) target identification.
Bulk analysis
On homogenised samples
Quantitative targeted Lipidomics
Our comprehensive lipidomic analysis includes over 2000 lipid species across 16 different lipid classes. Our analysis is compatible with cell cultures, plasma/serum, tissue and isolated cell organelles. You provide us with raw frozen material, we take care of lipid extraction, sample normalisation and state-of-the-art HILIC LC-MS/MS lipidomic analysis (have a look at our quick reference guide for more details). Our analysis includes an extensive data report that allows you to interactively explore your data.
Mediator Lipidomics
Mediator lipids are bioactive lipids that play important roles in signal transduction and immune response regulation. Since these lipids are very low abundant (sub-nanomolar concentrations) classic lipidomics techniques, even untargeted ones, typically do not detect these lipids. We have finetuned a specialised method using SPE extraction and targeted C18 LC-MS/MS that is able to quantify over one hundred mediator lipid species, across 16 different classes, including leukotrienes, lipoxins, prostaglandins, resolvins and protectins (check the full list and the quick reference guide).
Spatial analysis
On tissue sections
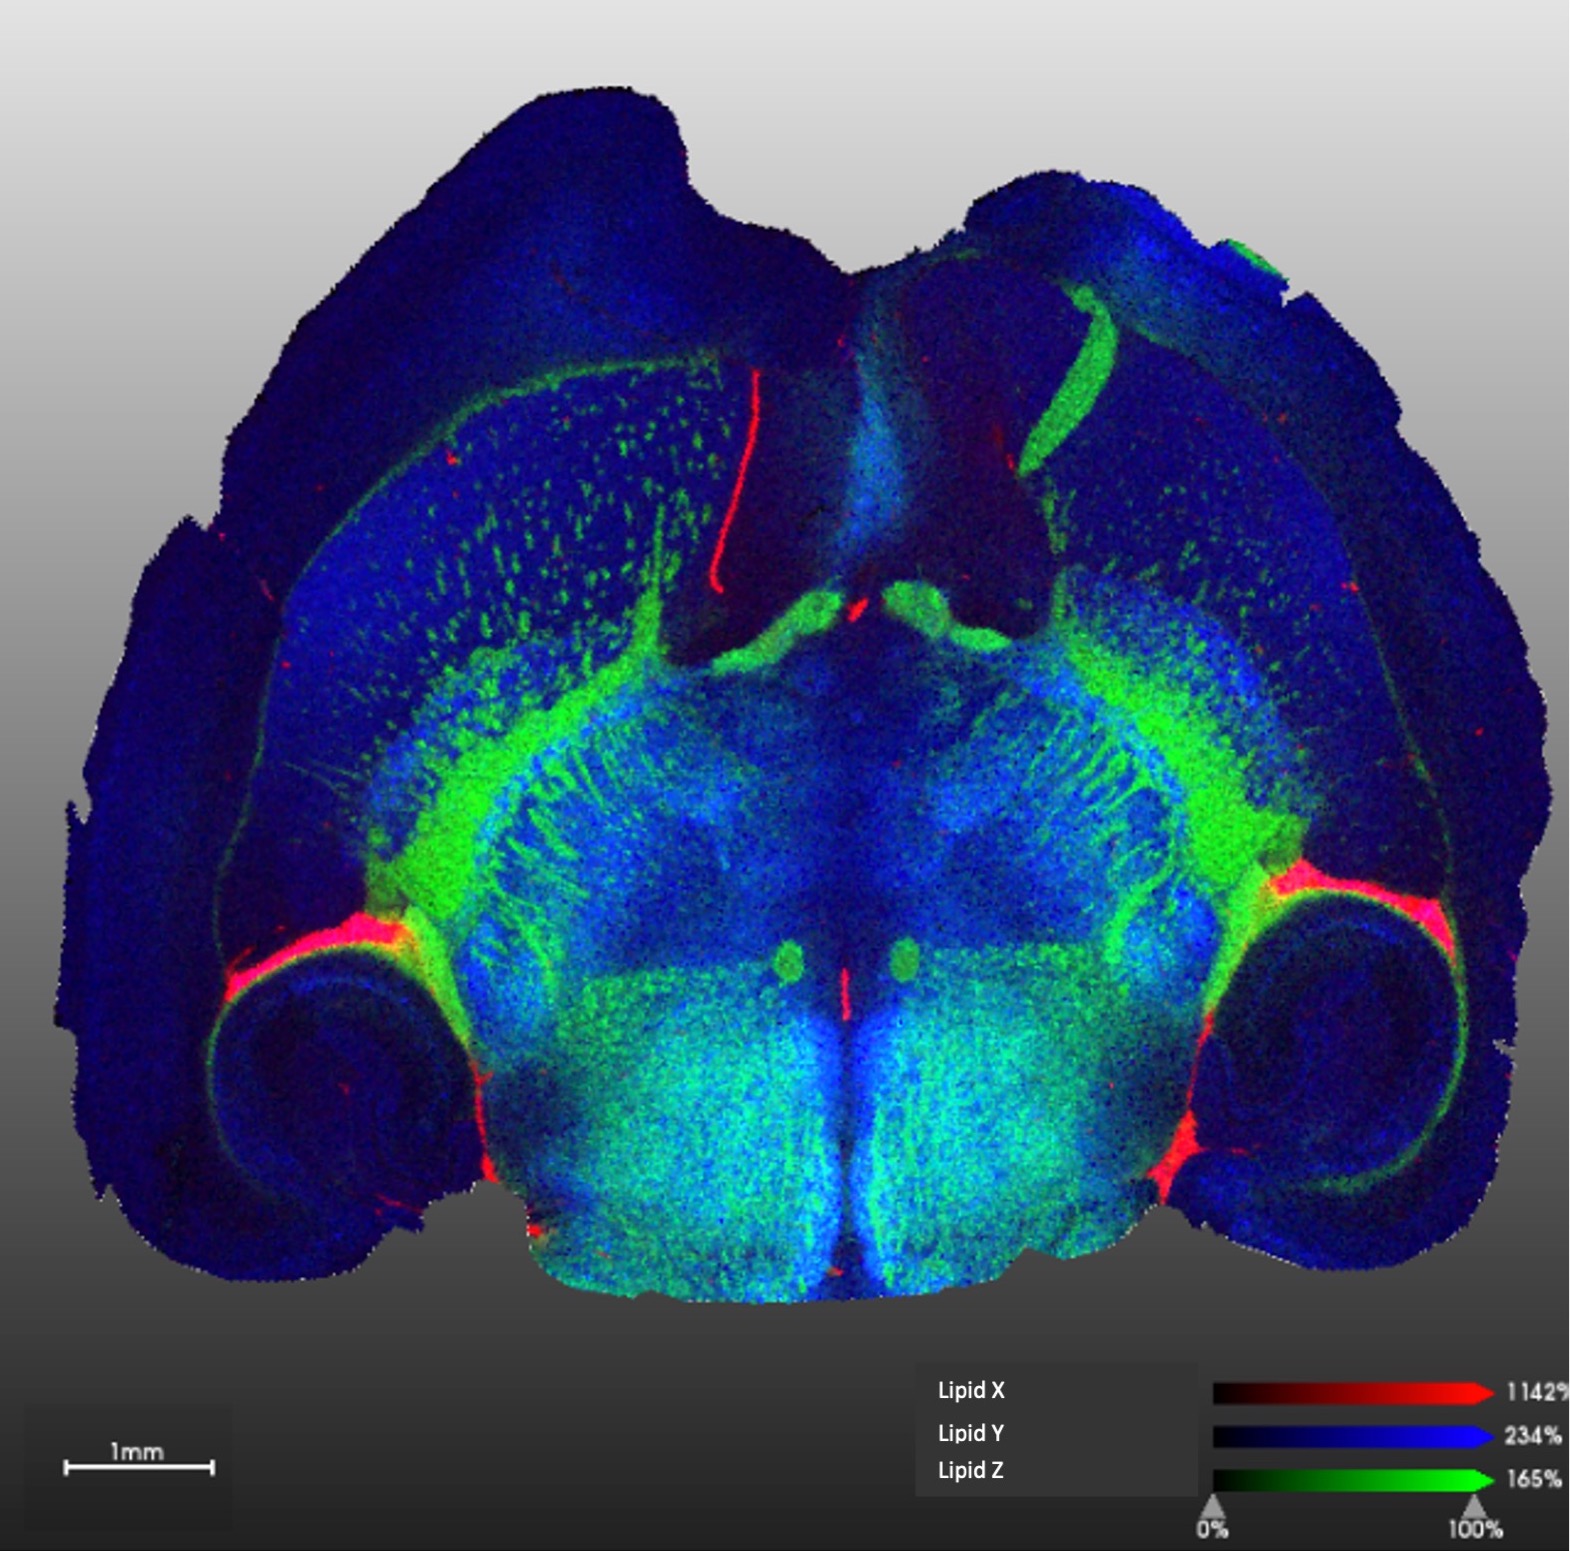
Spatial lipidomics
We offer spatial lipidomics services based on mass spectrometry imaging on a Bruker timsTOF fleX MALDI-2 ion mobility instrument. This technology brings the capability to image tissue sections prepared with standard methods at near single cell resolution (10 microns). We can identity and quantify 100s of lipids at each “pixel” of the image revealing tissue heterogeneity and offering unique opportunities for biomarker discovery and other applications. Contact us for further details and sample preparation instructions.
Custom development
If you are interested in measuring lipid species that are not part of our standard analysis, depending on your needs, we are able to set-up a custom method. We can also combine our analysis with metabolomics through our sister facility at VIB.
Contact us
Project participation
Lipometrix is keen on supporting your research projects through a collaborative approach. We routinely participate in funding applications to agencies in Belgium and internationally (Projects). Various collaboration models are possible, from pure service provision to sharing of intellectual property and co-authorship on papers.
Contact us